
U.S.Real Estate Private Equity vs. Stock and Bond Portfolio Return Comparison Study
(1978-2019)
Author: C-STAR Research
Abstract
How to allocate the portfolio to hedge the risks of return brought by stock market fluctuations? What kind of qualities does U.S. Real Estate Private Equity have? Why does U.S. Real Estate Private Equity stand out among other asset classes?
Real Estate is often a tangible investment that provides a different type of return than the stock and bond market; you can collect rent and gain appreciation on your property value to generate “recession-proof” returns. U.S. Real Estate Private Equity typically invests in significant real estate assets or real estate assets portfolios. If investing in portfolios, it can better diversify the single-property risk.
01
This article’ll examine how U.S. Real Estate Private Equity has historically performed during stock and bond market fluctuations. We use the NPI「1」as the benchmarking index of the performance of U.S Real Estate Private Equity and a 60/40 Stock and Bond portfolio「2」 index as the benchmarking index of the performance of stocks and bonds.
Quarterly Return Comparison
Using data collected from the National Council of Real Estate Investment Fiduciaries, we compared the performance of U.S. Real Estate Private Equity, represented by NPI, with a 60/40 Stock and Bond portfolio, over the past 168 quarters between 1978 and 2019.
Over the past 168 quarters, the 60/40 Stock and Bond portfolio has had negative returns in 42 quarters, with an average return of -3.82%, as the data show. The NPI has negative returns in just 15 quarters, down an average of -2.55%. Table 1 shows the returns for two asset classes in each declining quarter.
Therefore, over the past 42 years, the performance of U.S. Real Estate Private Equity has been more stable than the 60/40 Stock and Bond portfolio, and the investment risk of U.S. Real Estate Private Equity is much less than that of the 60/40 Equity and bond portfolio.
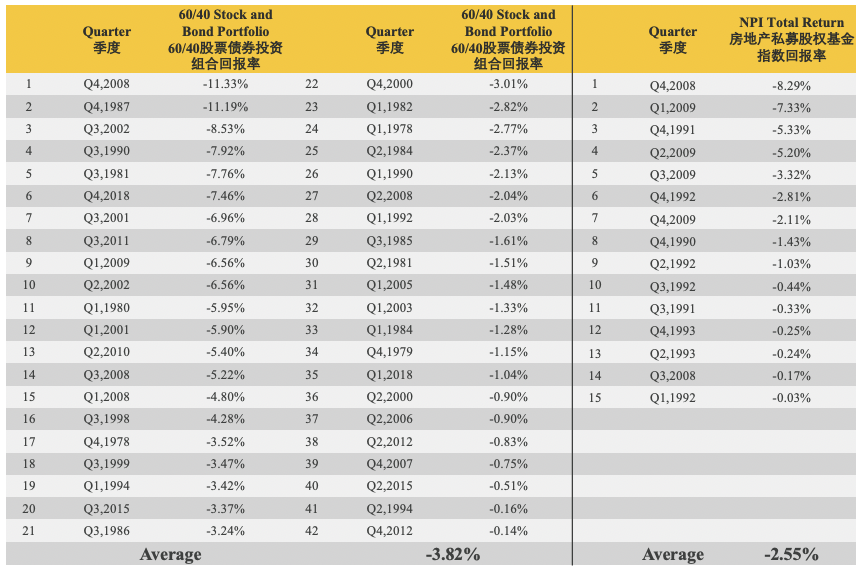
Table1
Further, we identified the 30 worst quarters for the 60/40 stock and bond portfolio between 1978 and 2019 and compared its quarterly returns with NPI Total Returns in those quarters.
The results in Figure 1 shows that in these 30 quarters, the returns of the 60/40 stock and bond portfolio were all negative, and the worst quarter was the fourth quarter of 2008, delivering a return of -11.33%. However, NPI Total Returns have been positive in 26 quarters and negative in only four quarters. The worst performer was the fourth quarter of 2008 when the quarterly return was -8.29%. The reason for the poor performance is that the burst of the U.S. housing price bubble was the main trigger for the financial crisis of 2008, which was a particular time for real estate investment. In other quarters, U.S. Real Estate Private Equity has held up relatively well, unaffected by volatilities in the stock and bond markets.

Figure1
02
Correlation Analysis Among Assets
Further, we examine the correlations among the NPI Total Returns, the S&P 500, the Barclays bond index, the 60/40 stock and bond portfolio and the FTSE NSREIT ALL REITS「3」.
The results in Table2 show that the correlations between NPI and other assets are very low. Among them, the correlation between NPI and 60/40 stock and bond portfolio is only 0.05, and the correlation between the NPI and FTSE NSREIT ALL REITS is only 0.11. Therefore, it is highly likely to increase the risk-adjusted return of the portfolio of stock an bond, by adding the U.S. Real Estate Private Equity portfolio.
Moreover, the correlation between the FTSE NSREIT ALL REITS and 60/40 stock and bond portfolio is 0.65. While public real estate products can be lucrative investments, they are highly correlated to the stock market. That means they rise and fall based on what’s happening in the economy, and their values can be impacted by events that have nothing to do with real estate fundamentals. Because of this, adding publicly traded REITs alone will not necessarily improve your portfolio’s risk-adjusted returns.

Table2
03
Conclusion
In summary, the return of U.S. Real Estate Private Equity has a massive advantage over other asset classes with a relatively stable cash flow, low volatility, and weak correlation with other assets. It scores a trifecta since most asset classes only have one or two qualities. Therefore, the U.S. Real Estate Private Equity can effectively hedge the stock and bond portfolio risks.
Data source: NCREIF; Bloomberg; NAREITReferences: “Latest Asset Class Correlations, Volatilities, and Beta: Up from Abnormally Low Levels, But Still Low” – NAREIT
04
C-Star U.S. Real Estate Private Equity Fund
Substantial Upside and Limited Risk Exposure
C-Star U.S. Real Estate Private Equity Fund is one of the most effective options for investors. Firstly, a real estate private equity can hedge the uncertainty of the stock and bond markets. Secondly, C-Star Real Estate Private Fund adopts a rental investment strategy; the fund gets a stable rental yield. The rent can still grow steadily in economic downturns. Moreover, housing is one of the necessity-based goods of human beings. The primary driving forces of Single-Family Rental are population growth, employment growth, and fundamental economic development, which are not affected by abnormal stock fluctuations.
C-Star Real Estate Private Equity Fund adopts a diversified investment strategy. The investment locations are Atlanta and Charlotte, and the investment properties are located in diverse geographics to minimize the risk of over-concentration. Each of the properties in the fund is operated as a separate business. So if one property underperforms, it doesn’t impact the returns of other properties. A single-project investment strategy does not offer this same benefit.
「1」NPI: NCREIF Property Index. It is a quarterly index, the unleveraged composite total return for institution-owned private commercial real estate properties held for investment purposes only. Real estate private equity fund managers in the U.S. mostly use NPI as a benchmarking index.
「2」60/40 Stock and bond portfolio: is a portfolio with 60% investing in S&P 500 Index and 40% investing in Bloomberg
Barclays U.S. Aggregate Bond.
「3」The FTSE Nareit All REITs Index is a market capitalization-weighted index that includes all tax-qualified real estate investment trusts (REITs) listed on the New York Stock Exchange or the NASDAQ National Market List.
To better gauge how well C-Star Fund II will perform, it also helps to look at its track record.
About C-Star SFR Fund I
C-Star closed and fully deployed Fund I in June 2019 and aggregated a $5.7 million portfolio. It contains 36 assets located in 9 counties of Atlanta MSA.
As of the fourth quarter of 2019, C-Star SFR Fund I has achieved a portfolio of 100% leased rate, 7.8% capitalization rate, 8.0% first-year Cash-On Cash, and 24.2% projected 3-year IRR.
About C-Star
C-STAR is a real estate investment management firm primarily in the Single Family Rental sector. It was founded in February 2018 and is headquartered in New York.
C-STAR successfully closed and fully deployed Fund I in June 2019 and aggregated a $5.7 million portfolio. It contains 36 assets located in 9 counties of Atlanta MSA.
In July 2019, C-Star launched Fund II, which targets raising $20 million USD of equity for investments in Atlanta and Triangle Charlotte MSA. C-Star SFR Fund II has made meaningful progress on fundraising, acquisition, financing, and asset management ever since its inception in October 2019. By the end of March, SFR Fund II had raised $7.12 million in equity and had closed eight acquisitions of single-family homes in the Atlanta metro area. 7 of 8 homes have been leased quickly after closing with an average lease-up period of 8 days. The average time between the renovation completion and the tenant's move-in date is 20 days.
Investment Strategy of Fund II:

Key Terms of Fund II:
Minimum Capital Commitment: $100,000
Investment Term: 3 years +1 year +1 year
Distribution: Initially, 5% – 6% increase annually, distributed quarterly
Target IRR: 18% – 20% gross
Acquisition Fee: 2% of Purchase Price
Asset Management Fee: 25bps on AUM annually
Note: C-STAR SFR Fund II has filed with the United States Securities and Exchange Commission (“SEC”) under Regulation D 506(c). www.sec.gov.